BigData Developing a graph in spark and scala
Overview
This article was also published on the site: https://dzone.com/articles/bigdata-developing-a-graph-in-spark-and-scala.
Recently in my work I needed to create a solution using graph to create a hierarchy of relationship between employees of the company. This is a simple problem, but I had never done it in the BigData area and using Apache Graphx.
In this case we were using Cloudera’s cluster environment that commercial environment, but the solution works the same way for the open-source versions.
For anyone interested in Cloudera solutions to study Big-Data you can download the virtual machine with a cluster configured and ready to use.
1. The problem
We need to ingest the employee data that was in the relational database Oracle for the cluster, do some data processing, and save it in Hive, but we did not have the relationships to create a hierarchy between the employee levels, so we used a table with auxiliary data and created a graph top-down to create the relationships.
Detail: Relational databases such as Oracle have the CONNECT BY function that works with the Hierarchy.
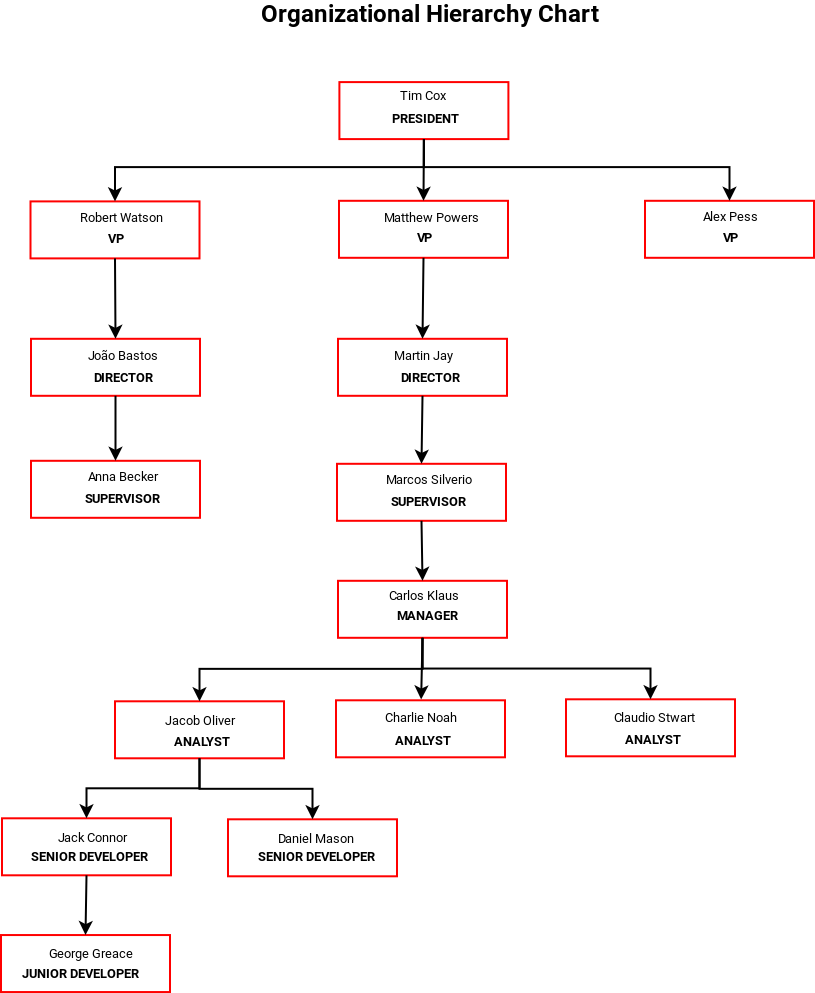
Below I did a hypothetical design of the employee hierarchy that has 9 levels:

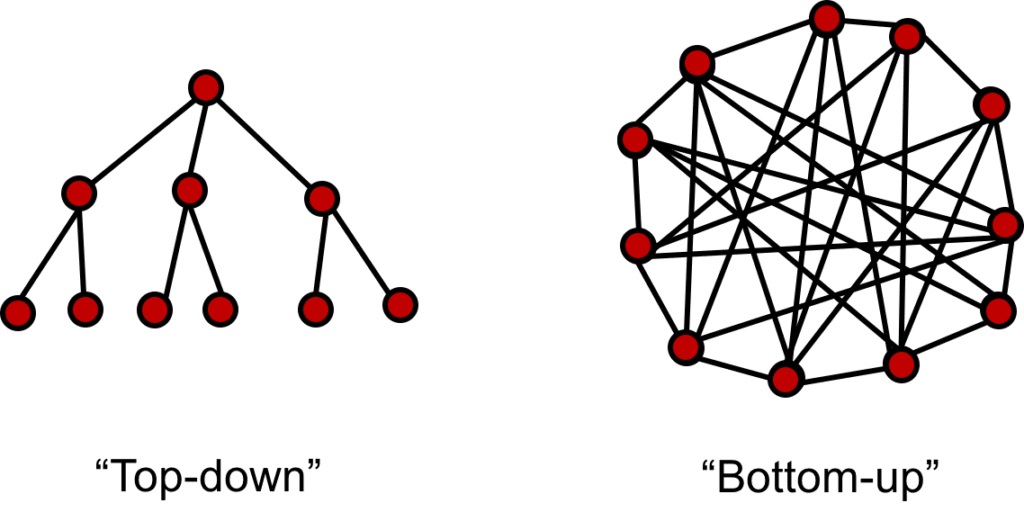
Graphx (pregel) has two types of graphs that are Top-Down and Bottom-Up, in which case it would be a modeling using Top-Down:

1.1 Start
After several transformations of the data, we arrive at a DataFrame similar to this one:
| Level | Role | Name | Connect By |
|---|---|---|---|
| 1 | PRESIDENT | Tim Cox | null |
| 2 | VP | Robert Watson | 1 |
| 3 | VP | Matthew Powers | 1 |
| 4 | VP | Alex Pess | 1 |
| 5 | DIRECTOR | João Bastos | 2 |
| 6 | DIRECTOR | Martin Jay | 3 |
| 7 | SUPERVISOR | Ana Becker | 5 |
| 8 | SUPERVISOR | Marcos Silverio | 6 |
| 9 | MANAGER | Carlos Klaus | 8 |
| 10 | ANALYST | Jacob Oliver | 9 |
| 11 | ANALYST | Charlie Noah | 9 |
| 12 | ANALYST | Claudio Stwart | 9 |
| 13 | SENIOR DEVELOPER | Jack Connor | 10 |
| 14 | SENIOR DEVELOPER | Daniel Mason | 10 |
| 15 | JUNIOR DEVELOPER | George Reece | 13 |
But this is only an example for our test, using the diagram above the hierarchy. The data containing null is considered the root of the relationship, in the case it would be a President or CEO of the company.
1.2 Analyzing the result
Creating a DataFrame with the above data for tests:
val empDF = sparkSession.sparkContext.parallelize(Array(
  ("1", "Tim Cox", "PRESIDENT", null.asInstanceOf[String]),
  ("2", "Robert Watson", "VP", "1"),
  ("3", "Matthew Powers", "VP", "1"),
  ("4", "Alex Pess", "VP", "1"),
  ("5", "Joao Bastos", "DIRECTOR", "2"),
  ("6", "Martin Jay", "DIRECTOR", "3"),
  ("7", "Anna Becker", "SUPERVISOR", "5"),
  ("8", "Marcos Silverio", "SUPERVISOR", "6"),
  ("9", "Carlos Klaus", "MANAGER", "8"),
  ("10", "Jacob Oliver", "ANALYST", "9"),
  ("11", "Charlie Noah", "ANALYST", "9"),
  ("12", "Claudio Stwart", "ANALYST", "9"),
  ("13", "Jack Connor", "SENIOR DEVELOPER", "10"),
  ("14", "Daniel Mason", "SENIOR DEVELOPER", "10"),
  ("15", "George Reece", "JUNIOR DEVELOPER", "13")))
  .toDF("id", "name", "role", "id_connect_by")
After running that DataFrame in the graph, you will get the following result:
+---+---------------+----------------+-------------+-----+-------+-----------------------------------------------------------------------------------------------------+--------+------+
|id |name           |role            |id_connect_by|level|root   |path                                                                                                 |iscyclic|isleaf|
+---+---------------+----------------+-------------+-----+-------+-----------------------------------------------------------------------------------------------------+--------+------+
|1  |Tim Cox        |PRESIDENT       |null         |1    |Tim Cox|/Tim Cox                                                                                             |0       |0     |
|4  |Alex Pess      |VP              |1            |2    |Tim Cox|/Tim Cox/Alex Pess                                                                                   |0       |1     |
|2  |Robert Watson  |VP              |1            |2    |Tim Cox|/Tim Cox/Robert Watson                                                                               |0       |0     |
|3  |Matthew Powers |VP              |1            |2    |Tim Cox|/Tim Cox/Matthew Powers                                                                              |0       |0     |
|5  |Joao Bastos    |DIRECTOR        |2            |3    |Tim Cox|/Tim Cox/Robert Watson/Joao Bastos                                                                   |0       |0     |
|6  |Martin Jay     |DIRECTOR        |3            |3    |Tim Cox|/Tim Cox/Matthew Powers/Martin Jay                                                                   |0       |0     |
|7  |Anna Becker    |SUPERVISOR      |5            |4    |Tim Cox|/Tim Cox/Robert Watson/Joao Bastos/Anna Becker                                                       |0       |1     |
|8  |Marcos Silverio|SUPERVISOR      |6            |4    |Tim Cox|/Tim Cox/Matthew Powers/Martin Jay/Marcos Silverio                                                   |0       |0     |
|9  |Carlos Klaus   |MANAGER         |8            |5    |Tim Cox|/Tim Cox/Matthew Powers/Martin Jay/Marcos Silverio/Carlos Klaus                                      |0       |0     |
|11 |Charlie Noah   |ANALYST         |9            |6    |Tim Cox|/Tim Cox/Matthew Powers/Martin Jay/Marcos Silverio/Carlos Klaus/Charlie Noah                         |0       |1     |
|12 |Claudio Stwart |ANALYST         |9            |6    |Tim Cox|/Tim Cox/Matthew Powers/Martin Jay/Marcos Silverio/Carlos Klaus/Claudio Stwart                       |0       |1     |
|10 |Jacob Oliver   |ANALYST         |9            |6    |Tim Cox|/Tim Cox/Matthew Powers/Martin Jay/Marcos Silverio/Carlos Klaus/Jacob Oliver                         |0       |0     |
|14 |Daniel Mason   |SENIOR DEVELOPER|10           |7    |Tim Cox|/Tim Cox/Matthew Powers/Martin Jay/Marcos Silverio/Carlos Klaus/Jacob Oliver/Daniel Mason            |0       |1     |
|13 |Jack Connor    |SENIOR DEVELOPER|10           |7    |Tim Cox|/Tim Cox/Matthew Powers/Martin Jay/Marcos Silverio/Carlos Klaus/Jacob Oliver/Jack Connor             |0       |0     |
|15 |George Reece   |JUNIOR DEVELOPER|13           |8    |Tim Cox|/Tim Cox/Matthew Powers/Martin Jay/Marcos Silverio/Carlos Klaus/Jacob Oliver/Jack Connor/George Reece|0       |1     |
+---+---------------+----------------+-------------+-----+-------+-----------------------------------------------------------------------------------------------------+--------+------+
Let’s understand the results:
| Field | Description |
|---|---|
| id | The number of the identifier or could be the enrollment of the employee, this number must be unique |
| name | The employee’s name |
| role | The position or job by the employee in the company |
| id_connect_by | It is the key of relationship that this employee is connected to another person |
| level | The level number that the employee is in the company, each possition must have a level |
| root | The father of all in the hierarchy |
| path | The path traveled until reaching the highest position (top dog) |
| iscyclic | The number of vertices in Cn equals the number of edges, and every vertex has degree 2 |
| isleaf | Determines whether a vertex is a leaf |
1.3 Code
To do more tests, please download the code in the repository:
git clone https://github.com/edersoncorbari/scala-lab.gitIn the readme file of the project you have the tips on how to run and test.
1.4 References
Graph theory is something we see in discrete math in high school and then we go deeper into my case computer science in data structure. Below are some references to remember and study:
- MIT Computer Science Course Lecture on Graph Theory
- https://spark.apache.org/graphx/
- https://dzone.com/articles/processing-hierarchical-data-using-spark-graphx-pr
- Spark Graphx in Action
Thanks!
