This article was also published on the site: https://dzone.com/articles/building-a-dataset-with-blood-donation-stock-data.
I was looking to analyze the blood donation data from Brazilian blood centers. To my surprise this data is not standardized, nor is there an API to show this information.
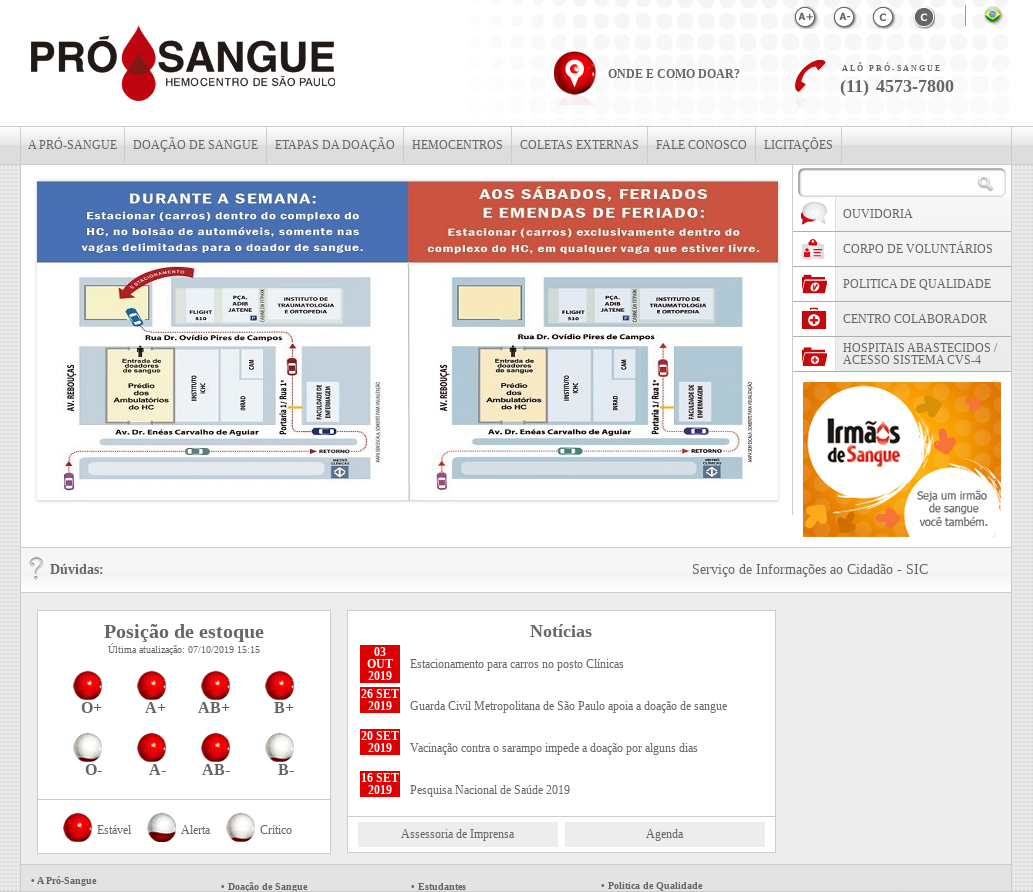
So the way I found it was to create a web-scraping to read this information. I used for this study the Pró-Sangue Foundation of the state of São Paulo - Brazil.
The solution was to create a web-scraping to extract this information from the site.
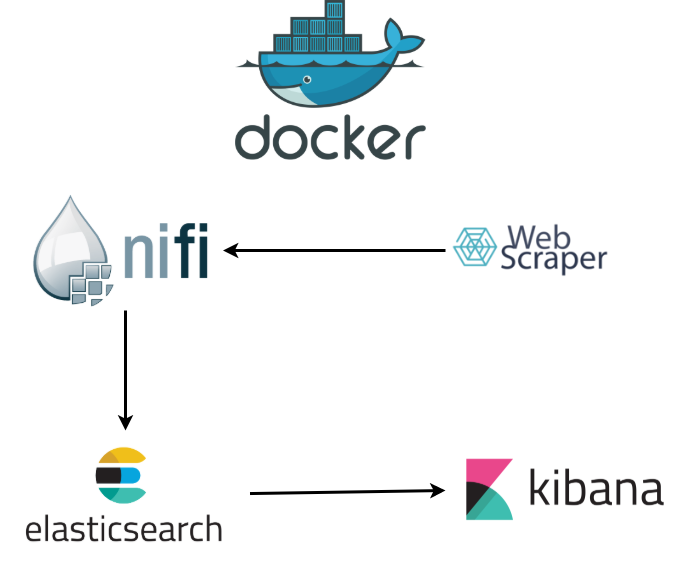
I have more audacious interest for this study. So an architecture was created using the following technologies:
Website of the Pró-sangue foundation of the state of São Paulo:
Architecture used in the project:
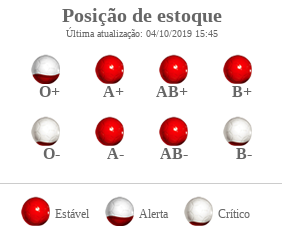
The information I am interested in is the current position of the blood supply with all blood types.
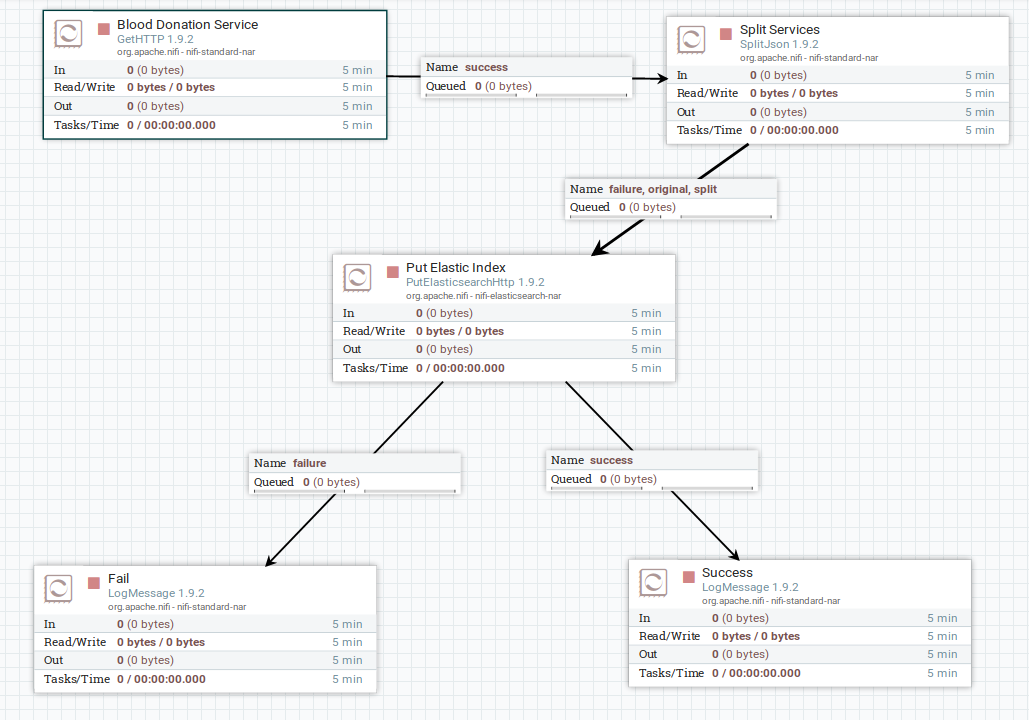
It is possible to do a web-scraping with NiFi, but I found it complex. And thinking of mapping other sites, I decided to use Python with the BeautifulSoup library and Flask for the micro-service.
The code is available in: https://github.com/edersoncorbari/blood-donation
I extract the information blood-donation/web-scraping/scraping.py.
       b1 = {
            "blood": "O+",
            "status": self.numStatus(
                self.stock.find(
                    id="cphConteudo_Estoque1_Repeater1_lblO_0")['class'][0]),
            "update": self.update,
            "timestamp": self.timestamp}
      ...

      bloods = (b1, b2, b3, b4, b5, b6, b7, b8)
      return json.loads(json.dumps(bloods))
An important factor for Kibana is standardization of data types. He works best with numbers and dates. So type conversions are done, could be handled by NiFi too, but it gets more complex.
The endpoint (http://127.0.0.1:5000/blood-current-position) will return the information:
[
    {
        "blood": "O+",
        "status": 2,
        "timestamp": "2019-10-07T17:48:24.899Z",
        "update": "2019-10-07T15:15:00.000Z"
    },
    {
        "blood": "A+",
        "status": 2,
        "timestamp": "2019-10-07T17:48:24.899Z",
        "update": "2019-10-07T15:15:00.000Z"
    },
    {
        "blood": "AB+",
        "status": 2,
        "timestamp": "2019-10-07T17:48:24.899Z",
        "update": "2019-10-07T15:15:00.000Z"
    },
    {
        "blood": "B+",
        "status": 2,
        "timestamp": "2019-10-07T17:48:24.899Z",
        "update": "2019-10-07T15:15:00.000Z"
    },
    {
        "blood": "O-",
        "status": 0,
        "timestamp": "2019-10-07T17:48:24.899Z",
        "update": "2019-10-07T15:15:00.000Z"
    },
    {
        "blood": "A-",
        "status": 2,
        "timestamp": "2019-10-07T17:48:24.899Z",
        "update": "2019-10-07T15:15:00.000Z"
    },
    {
        "blood": "AB-",
        "status": 2,
        "timestamp": "2019-10-07T17:48:24.899Z",
        "update": "2019-10-07T15:15:00.000Z"
    },
    {
        "blood": "B-",
        "status": 0,
        "timestamp": "2019-10-07T17:48:24.899Z",
        "update": "2019-10-07T15:15:00.000Z"
    }
]
I now have standardized data.
With NiFi we were able to create flow-based programming, and then scale up later creating other clusters.
It makes it much easier to take data from one type of source, and send it to another. In this case read an API-Rest and put the data into Elasticsearch.
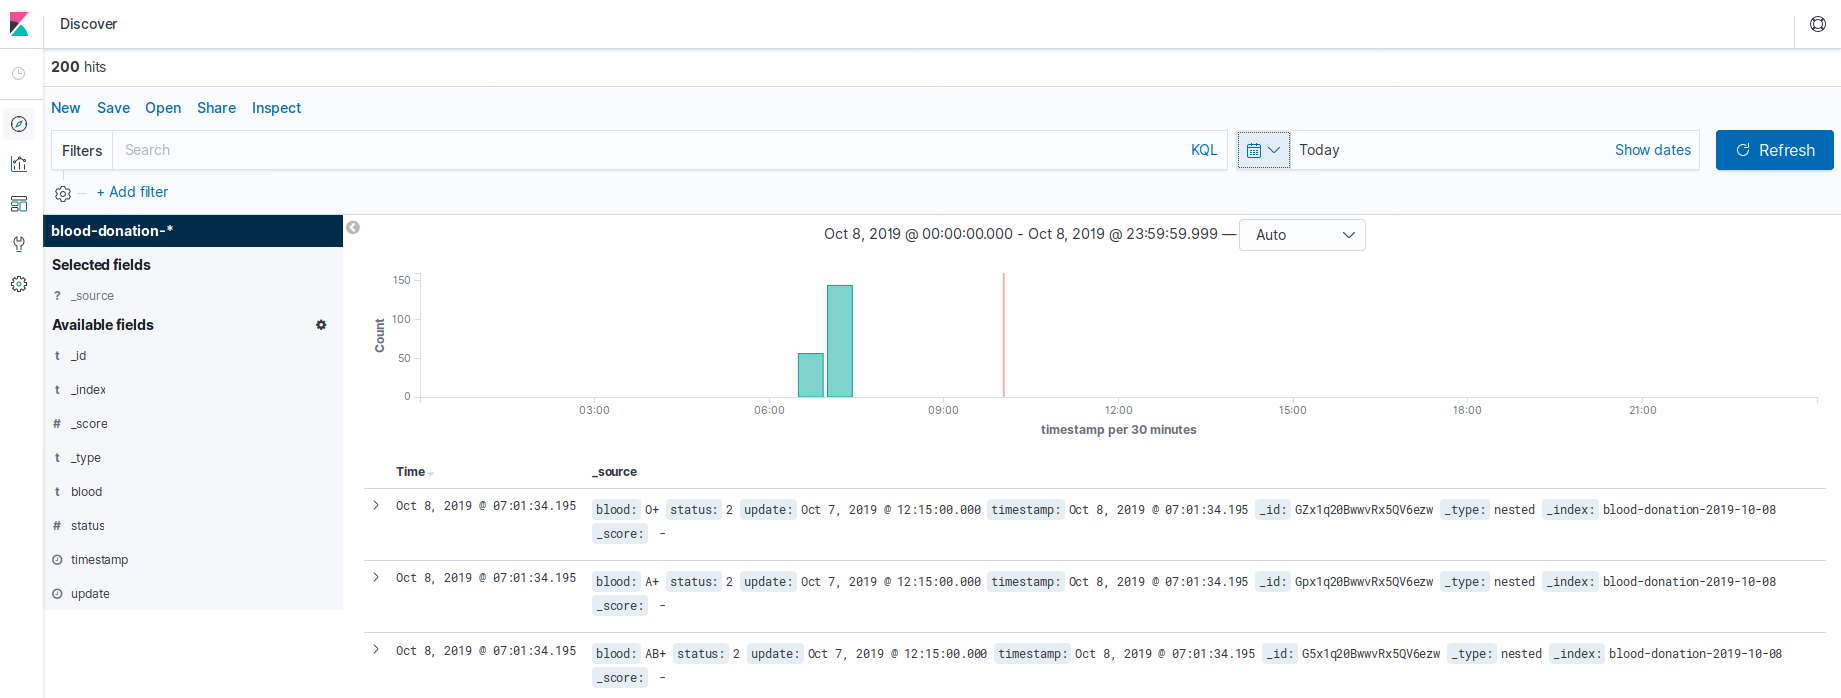
Now with the data in Elasticsearch, we can see in Kibana:
From now on you can create your visualizations for use in dashboard or canvas. With paid version it is also possible to create thresholds, using e-mail, slack, etc…
To run the code and test NiFi with Elastick and Kibana, please look at the documentation in the repository below:
In another tutorial I will show how the graphics were.
Thanks!