This article was also published on the site: https://dzone.com/articles/hdfs-offline-analysis-of-fsimage-metadata.
HDFS that is part of Hadoop has a command to download a current namenode snapshot. With this image we can load via Spark or make an ingestion in Hive to analyze the data and verify how is the use of HDFS.
The HDFS file system metadata are stored in a file called the FsImage. Contained in this snapshot we have:
The problem I had to solve is the following steps:
The FSImage can generate image in CSV, XML or distributed format, in my case I had to evaluate the blocks and acls as they are fields of type array in CSV format they do not work. You can see more details here:
To generate image, check where it is in the name node:
hdfs getconf -confKey dfs.namenode.name.dirNow let’s download the image to /tmp, in my case the file that was being analyzed is 35 GB in size:
hdfs dfsadmin -fetchImage /tmpIt is now necessary to convert to readable format, in this case XML:
hdfs oiv -p XML -i /tmp/fsimage_0000000000000103292 -o fsimage.xmlIt used the Databricks library for XML, and it is very easy to load because it already transforms the data into a dataframe. You can see all the details here: https://github.com/databricks/spark-xml.
The structure of my HIVE table:
USE analyze;
CREATE EXTERNAL TABLE IF NOT EXISTS analyze.fsimage_hdfs
(
  id string COMMENT 'Unique identification number.',
  type string COMMENT 'Type of data: directory or file, link, etc...',
  name string COMMENT 'Name of the directory or file.',
  replication string COMMENT 'Replication number.',
  mtime string COMMENT 'The date of modification.',
  atime string COMMENT 'Date of last access.',
  preferredblocksize string COMMENT 'The size of the block used.',
  permission string COMMENT 'Permissions used, user, group (Unix permission).',
  acls string COMMENT 'Access Permissions: Users and Groups.',
  blocks string COMMENT 'Size blocks',
  storagepolicyid string COMMENT 'ID number of the access policies.',
  nsquota string COMMENT 'Quota name, if -1 is disabled.',
  dsquota string COMMENT 'Space available and evaluated for user/group, if -1 is disabled.',
  fileunderconstruction string COMMENT 'File or directory still under construction/replication.',
  path string COMMENT 'Path of the file or directory.'
)
PARTITIONED BY (odate string, cluster string)
ROW FORMAT SERDE 'parquet.hive.serde.ParquetHiveSerDe'
STORED AS INPUTFORMAT 'parquet.hive.DeprecatedParquetInputFormat'
OUTPUTFORMAT 'parquet.hive.DeprecatedParquetOutputFormat'
LOCATION '/powerhorse/bicudo/analyze/fsimage_hdfs';
In my scenario, because there are other clusters to be analyzed, a partition was created with the ISO standard ingestion day and the cluster name.
Using the spark-xml library is very easy to make the parser in the file, read, modify and save the data. Simple example loaded XML:
val df = sparkSession.sqlContext.read
  .format("com.databricks.spark.xml")
  .option("rowTag", "inode")
  .option("nullValue", "")
  .load(pathFsImage)
I also create a sample code that you can run and test with your image: https://github.com/edersoncorbari/scala-lab
In these analyzes was used SQL and the GnuPlot to view the data, but could be other tools like:
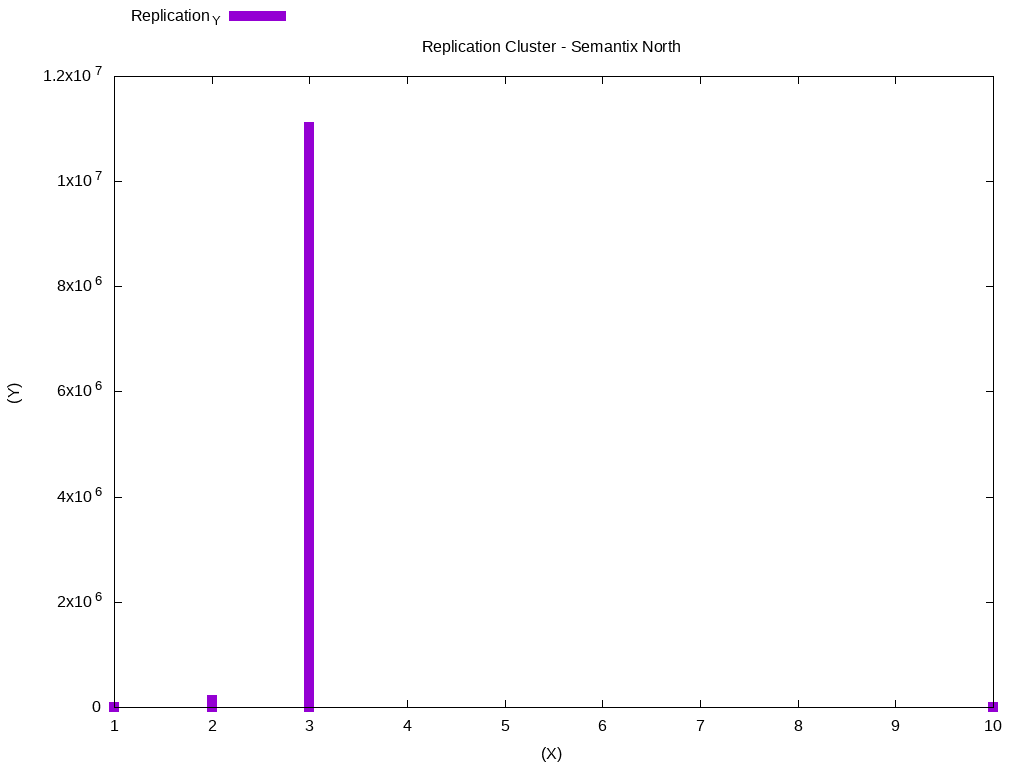
Continuing, with our JOB batch data, you can now do some analysis. Generating a histogram with the most commonly used replication values in the cluster:
SELECT cast(hist.x AS int) AS x,
       cast(hist.y AS bigint) y
FROM
  (SELECT histogram_numeric(cast(replication AS DOUBLE), 40) AS T0
   FROM analyze.fsimage_hdfs
   WHERE dataingestao='2019-01-27'
     AND CLUSTER='SEMANTIX_NORTH'
     AND preferredblocksize <> '')
   T1 LATERAL VIEW explode(T0) exploded_table AS hist;
There are several types of graphics you can do using GnuPlot, please look here for more examples: GnuPlot Demos. It is necessary that you copy the output in the histogram and place in example file replication.dat:
Replication_X	Replication_Y
1	29
1	3
2	77975
2	12602
2	47204
2	139973
2	17612
2	24402
3	170164
3	7461229
3	11038655
3	1443494
3	1910188
10	9267
10	6492
10	1719
10	1207
10	1318
Now copy the code below and run:
#!/usr/bin/gnuplot
reset
clear

set datafile separator "\t"
set terminal png size 1024,768
set output "histogram-replication.png"

set title "Replication Cluster - Semantix North"
set xlabel "(X)"
set ylabel "(Y)"
set key top left outside horizontal autotitle columnhead

plot 'replication.dat' u 1:2 w impulses lw 10
The generated data will look like this:
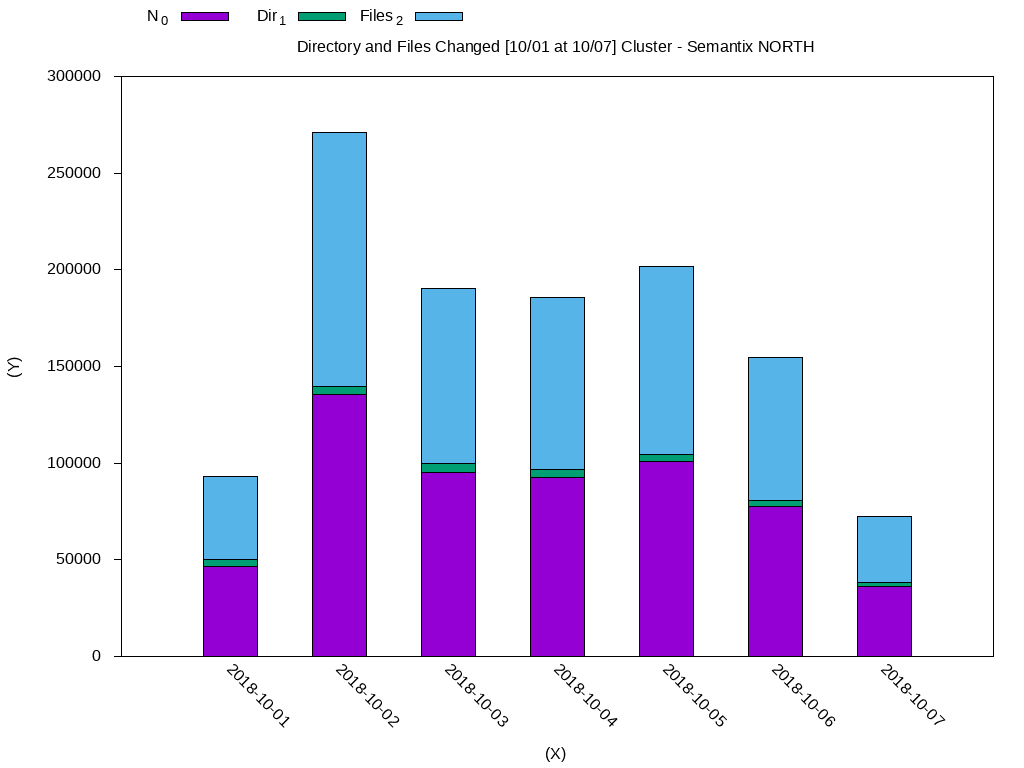
In this case, most data is using replication block 3. We can do another analysis, to check the files that were modified in the period of one week. Standardize the output of the histogram with the weekly-changes.dat file:
Date	N_0	Dir_1	Files_2
2018-10-01	46588.0	3579.0	43009.0
2018-10-02	135548.0	4230.0	131318.0
2018-10-03	95226.0	4600.0	90626.0
2018-10-04	92728.0	4128.0	88600.0
2018-10-05	100969.0	3527.0	97442.0
2018-10-06	77346.0	3455.0	73891.0
2018-10-07	36326.0	1711.0	34615.0
Using GnuPlot:
#!/usr/bin/gnuplot
reset
clear

set datafile separator "\t"
set terminal png size 1024,768
set output "histogram-weekly-changes.png"

set title "Directory and Files Changed [10/01 at 10/07] Cluster - Semantix NORTH"
set xlabel "(X)"
set ylabel "(Y)"

set key top left outside horizontal autotitle columnhead
set xtic rotate by -45 scale 0
set ytics out nomirror
set style fill solid border -1
set boxwidth 0.5 relative

set style data histograms
set style histogram rowstacked

plot 'weekly-changes.dat' using 2:xtic(1) ti col, '' u 3 ti col, '' u 4 ti col
The generated data will look like this:
I will leave some other querys that may be useful:
-- Convert Unix timestamp to ISO.
SELECT date_format(from_unixtime(cast(mtime/1000 AS bigint)), 'yyyy-MM-dd')
FROM fsimage_hdfs LIMIT 10;

-- Checking the size of the blocks used and converting bytes to GB.
SELECT permission,
  count(1) AS totalfiles,
  round(sum(cast(preferredblocksize AS DOUBLE))/1024/1024/1024, 2) AS sizegb
FROM fsimage_hdfs
WHERE odate='2019-01-22'
  AND `cluster`='SEMANTIX_NORTH'
GROUP BY permission LIMIT 10;

-- Files modified on a specific date.
SELECT count(*) FROM fsimage_hdfs WHERE odate='2018-12-22'
  AND `cluster`='SEMANTIX_NORTH'
  AND date_format(from_unixtime(cast(mtime/1000 AS bigint)),
'yyyy-MM-dd')='2019-01-22';Documents that helped in the publication of this article:
Thanks!